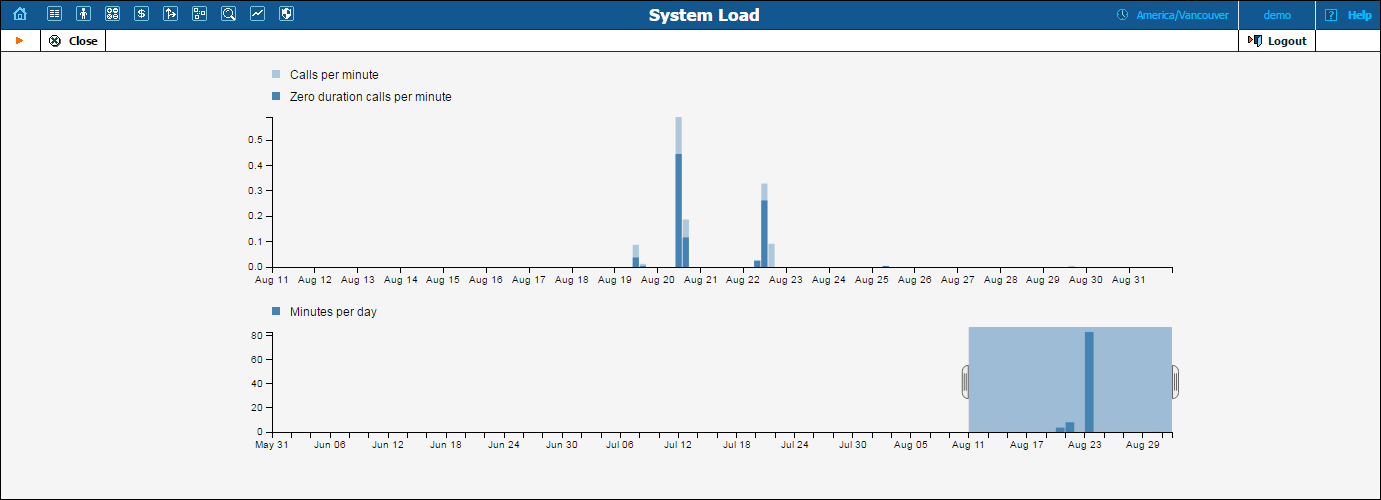
The System Load graph provides a general overview of the billing system status in terms of the number of call attempts per minute and the total volume of calls per day.
The Calls/minute graph at the top shows the number of calls, and is broken down into “Billable” and “Zero Duration” calls.
The Daily minutes graph shows the total call volume (in minutes) that passes through your system per day.
The default timeframe for all graphs is 30 hours. The dates above the graph are the boundary timeframe for the current graph. If the graph is shown in more than one color, a legend for color use will be displayed below the graph. If there are two graphs, captions will be provided on the left.