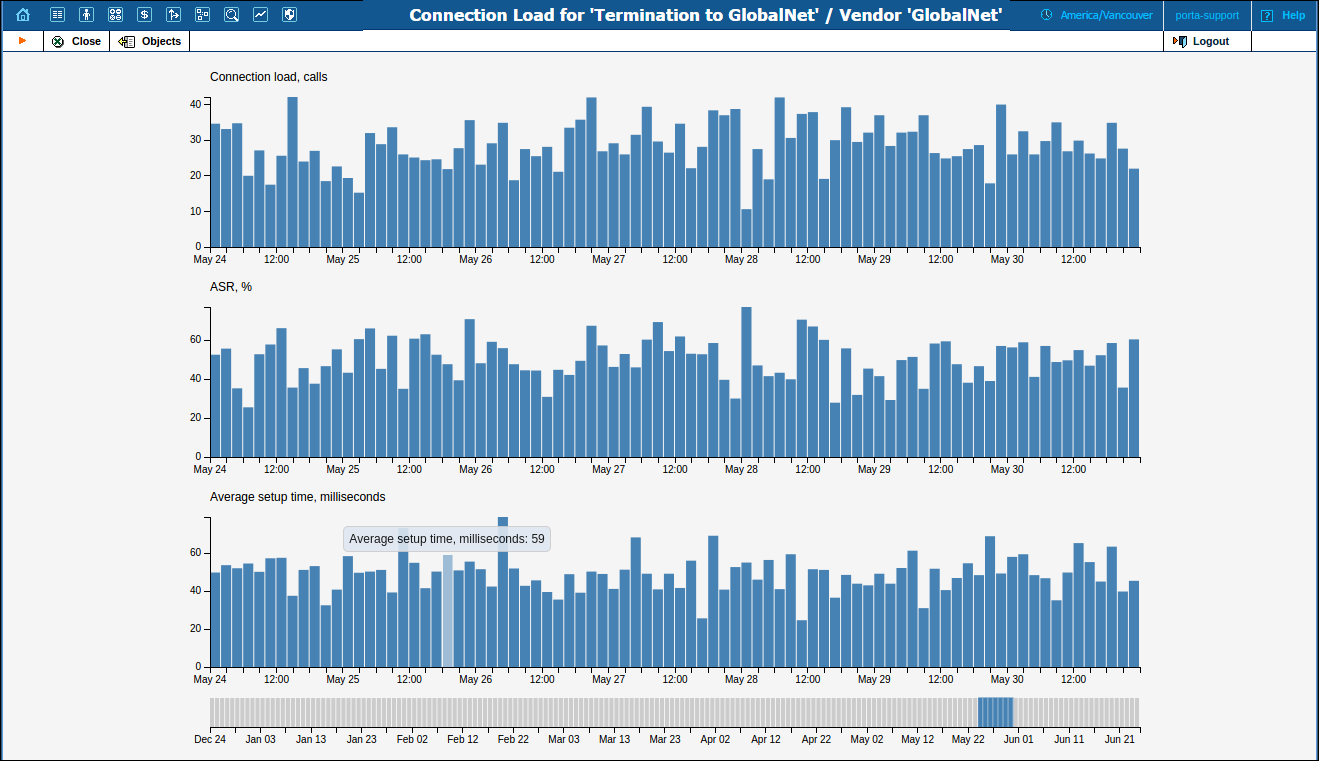
This page provides the user with access to load graphs for a particular connection.
The graphs show the connection load, setup time and ASR (Average Success Rate) statistics. Information appears on the graphs with a one- hour delay.
Assumptions: To make load calculations easier, calls longer than one hour are ignored (and since these calls are quite rare, they do not really affect the final results). Also, although a failed call has no duration, it still occupies a port on the gateway (while the gateway is trying to connect the call). Therefore, when making calculations, failed calls are regarded as occupying the port for 10 seconds.
By default, the graphs provide connection load information for the last day. To display graphs for longer time periods (within the last 6 months), select the time period from the scale below.